How to Create a Bookmark in Power BI
In this tutorial, you will learn how to use bookmarks in Power BI to create interesting and useful reports. Bookmarks were introduced a few months ago and they can be very useful to capture key data and create powerful reports.
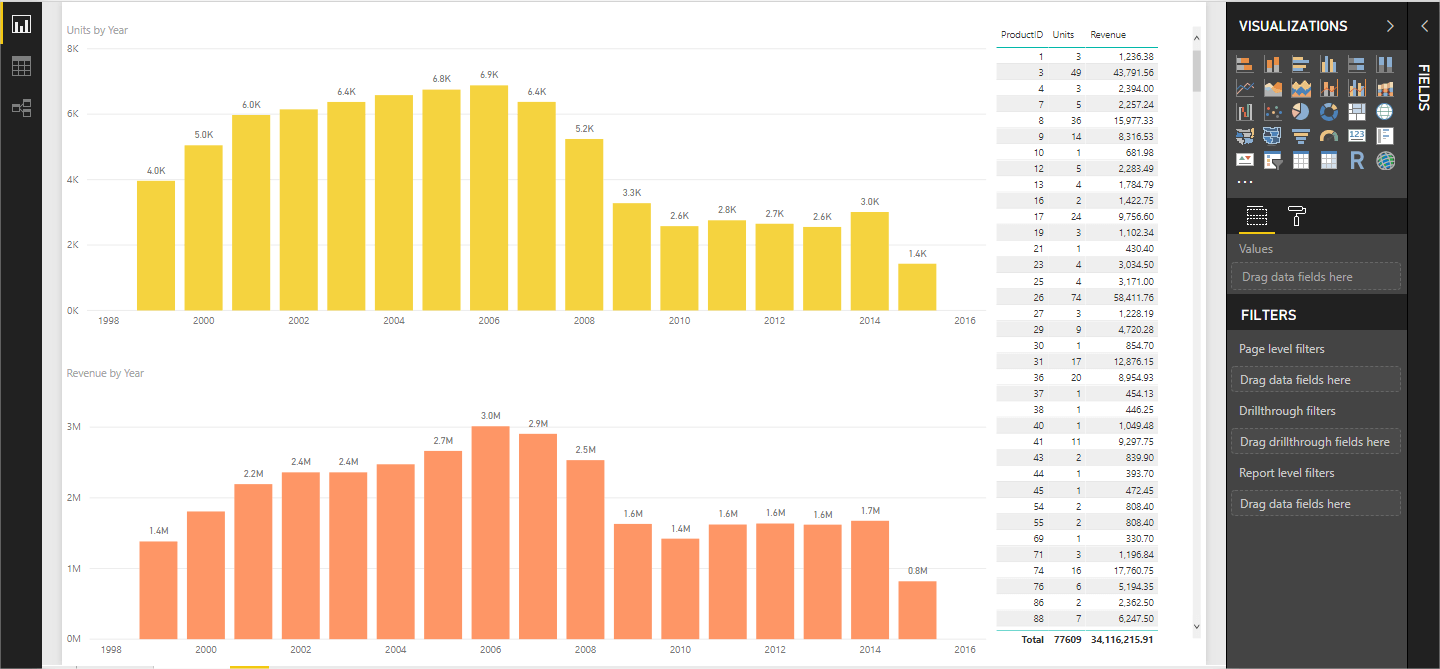
In this example, we will be creating a report with bookmarks that show the sales data for four individual countries. To start, let’s take a simple dataset containing Sales columns.
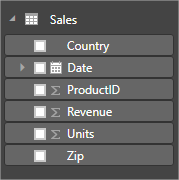
If you put the data in a table visual, you will see that the data represents sales in four countries: Canada, France, Germany and Mexico:

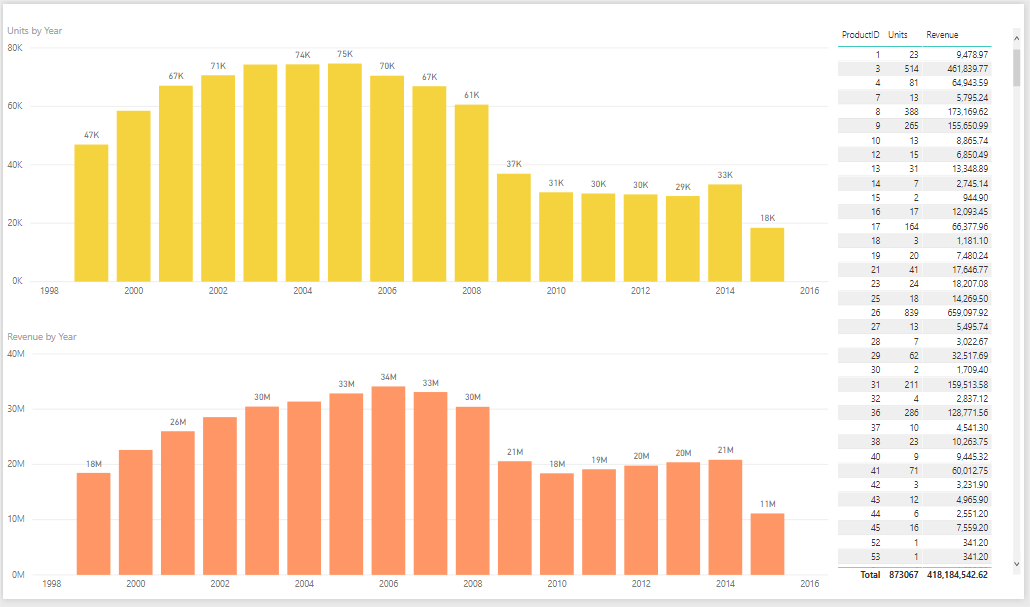
This report contains three visuals:
- Units by Year, Quarter, Month and Day
- Revenue by Year, Quarter, Month and Day, and
- A table visual showing unit sold and revenue by ProductID
To view the data by country, we will be adding a Slicer and Bookmark for every country.
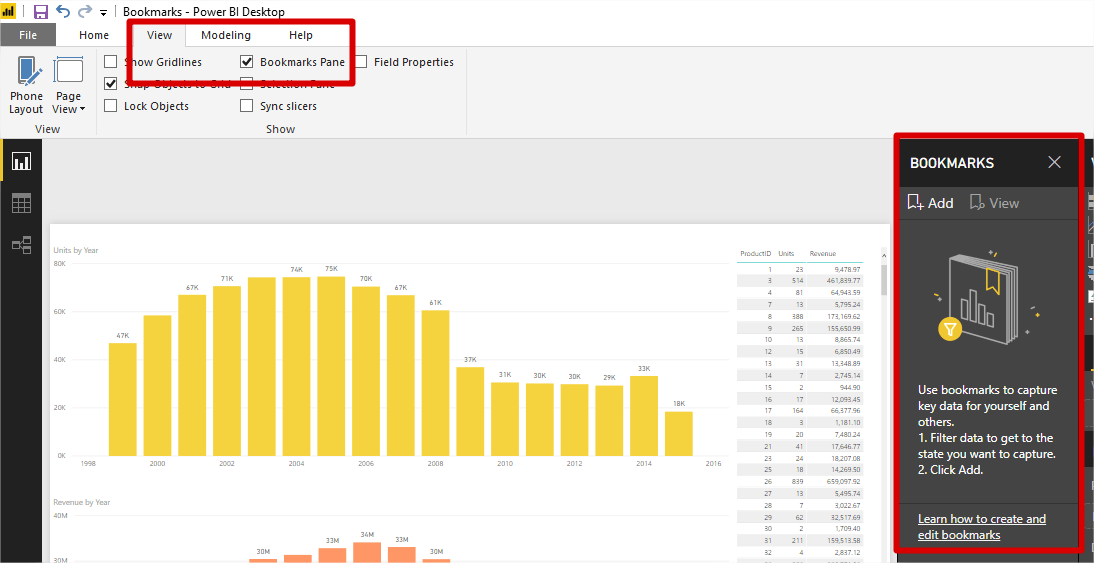
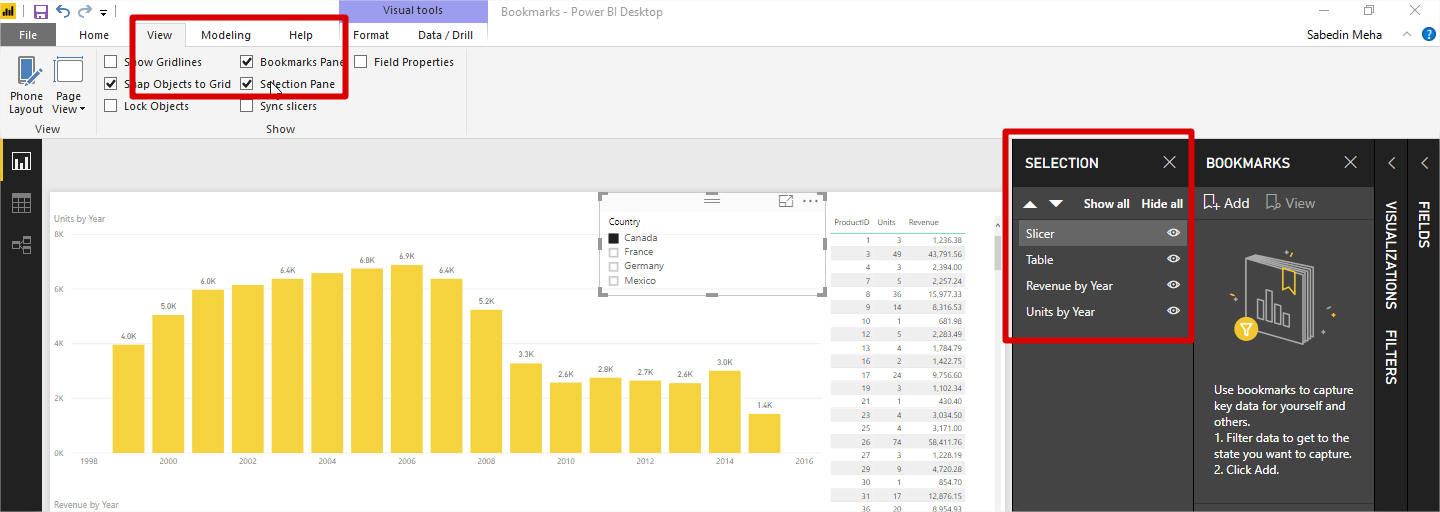
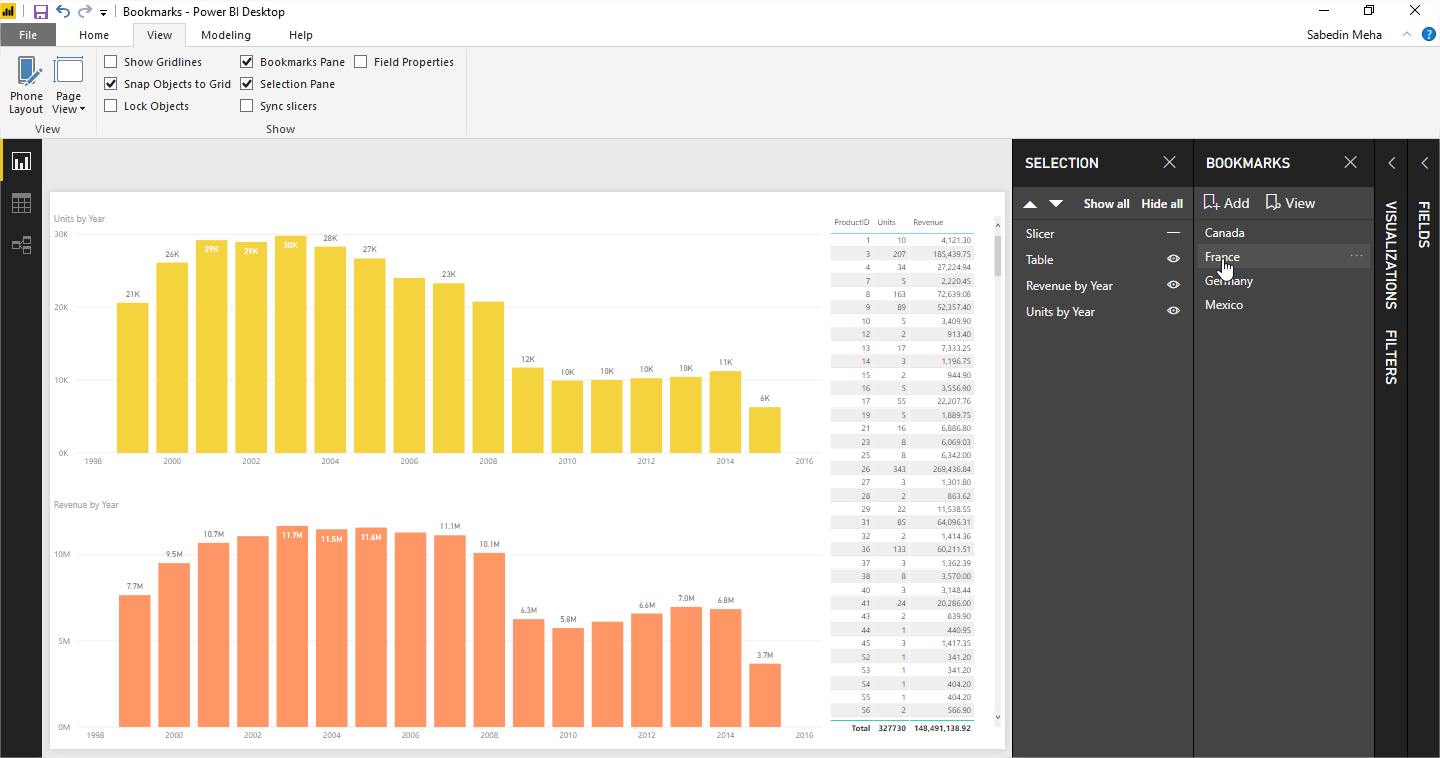
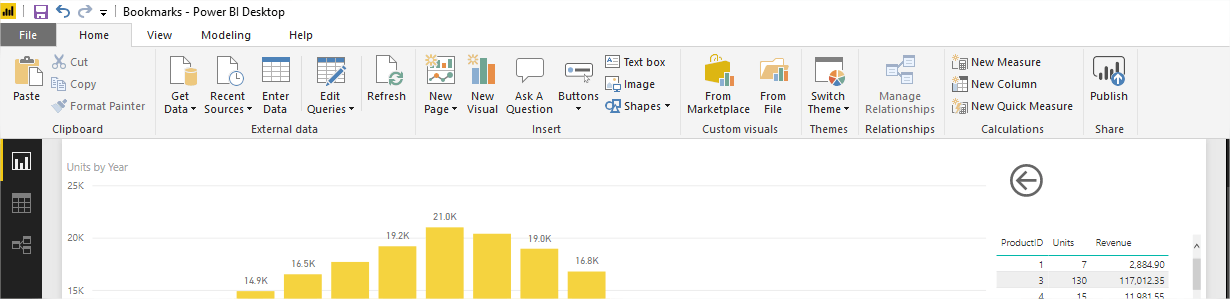
Start by enabling the Bookmarks Pane. Go to the View tab and check the Bookmarks Pane box, where it will appear next to the Visualizations Pane.
Before you create the Bookmarks, you first need to add the Country Slicer.
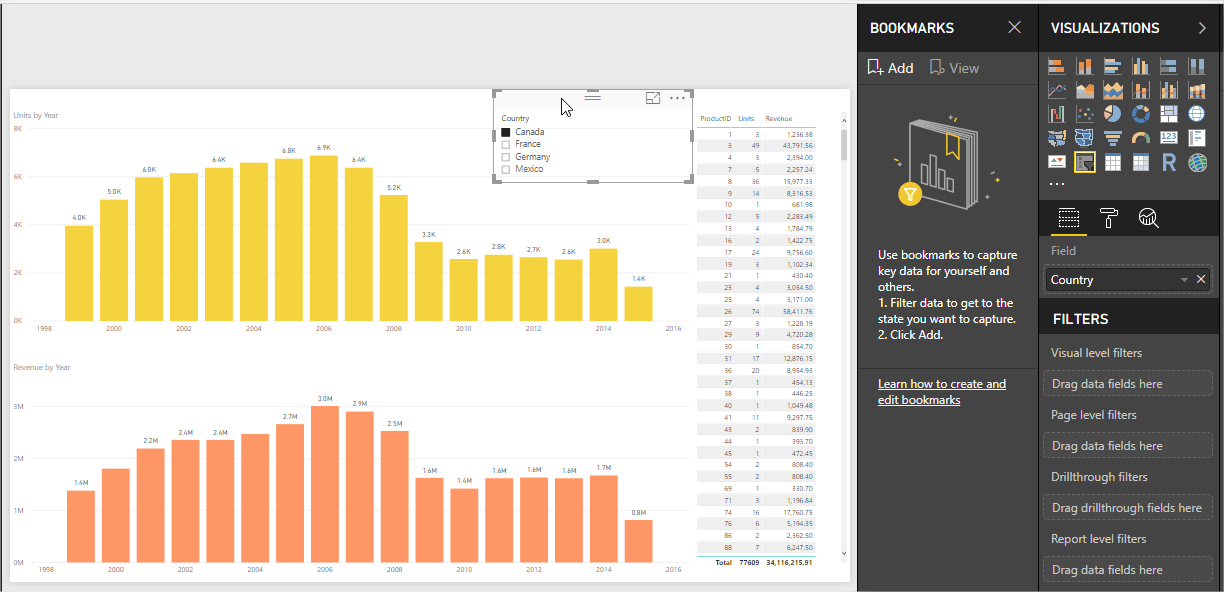
You don’t need to see the Slicer in the actual report, so go ahead and remove the Slicer in appearance (not selection) by adding the Selection Pane and hiding the Slicer.

Now, we are ready to add the Bookmarks. Click Add:
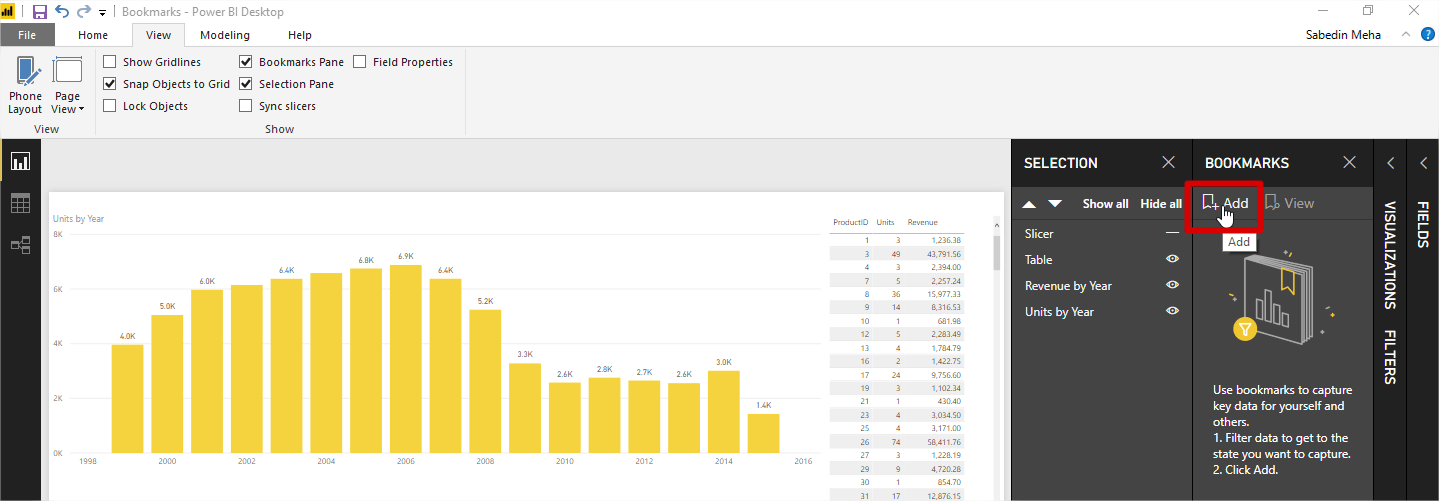
Since the report presents Canada data based on the Slicer selection, rename the Bookmark from Bookmark1 to Canada.

To add the three other bookmarks, you need to show the Slicer. Follow the same steps as above and make the selection first, then hide the slicer and create the bookmark.
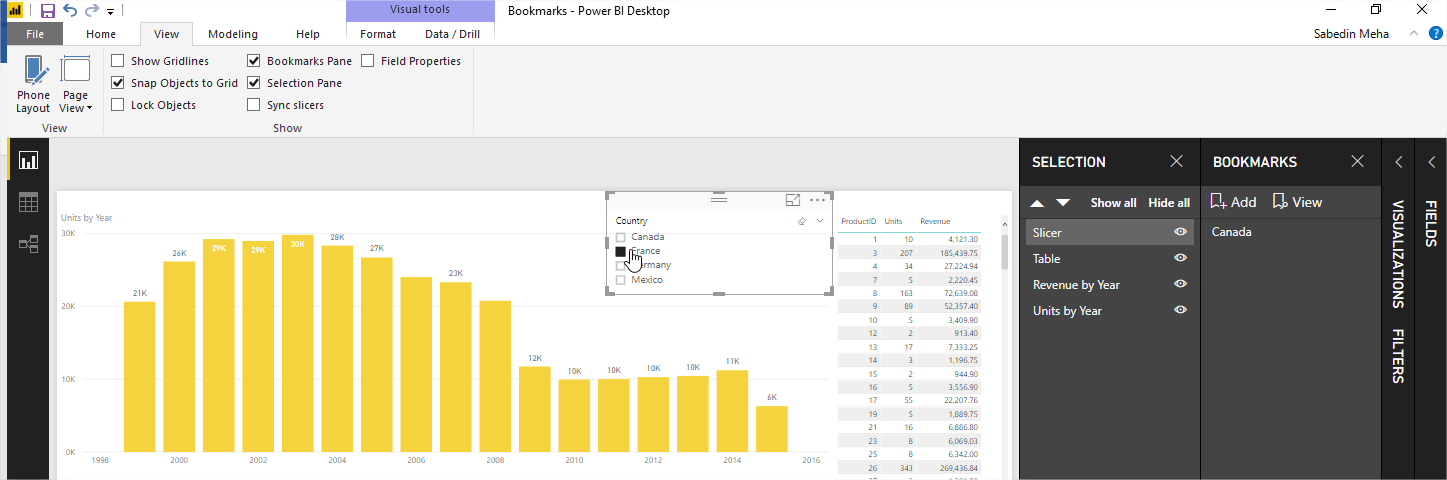
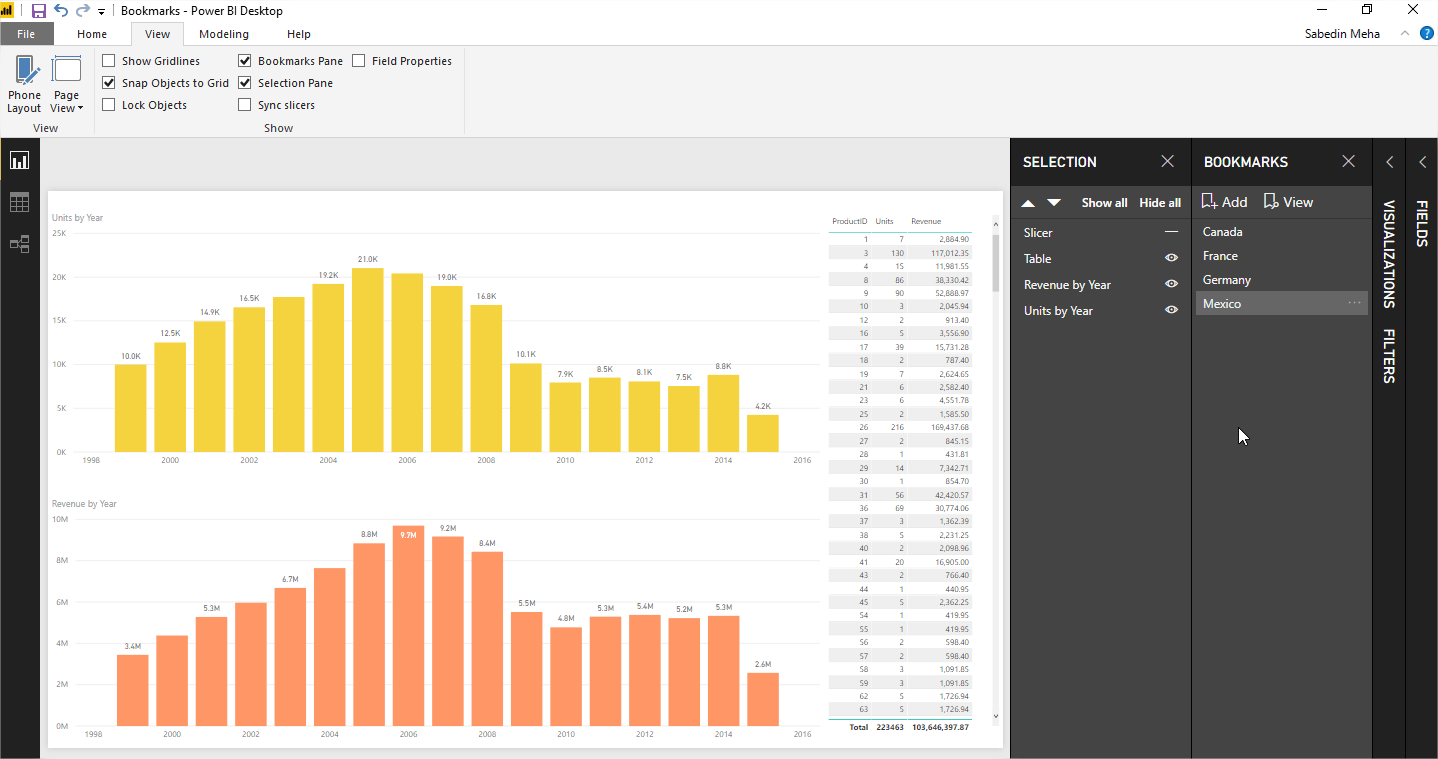
Once you add all four bookmarks, you can see what they represent by clicking each of them in the Bookmarks Pane.
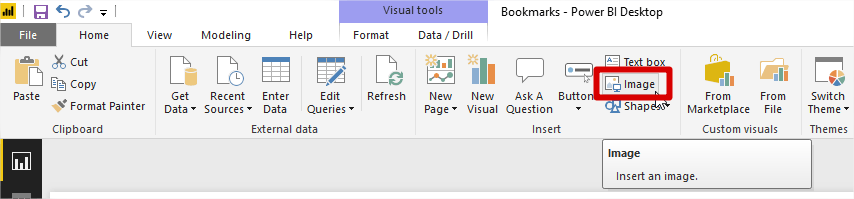
Next, we will be creating a “Landing Page” for your report to add the flags of each country and then link the flag images to the bookmarks we just added. On the Home tab, click the Image button.
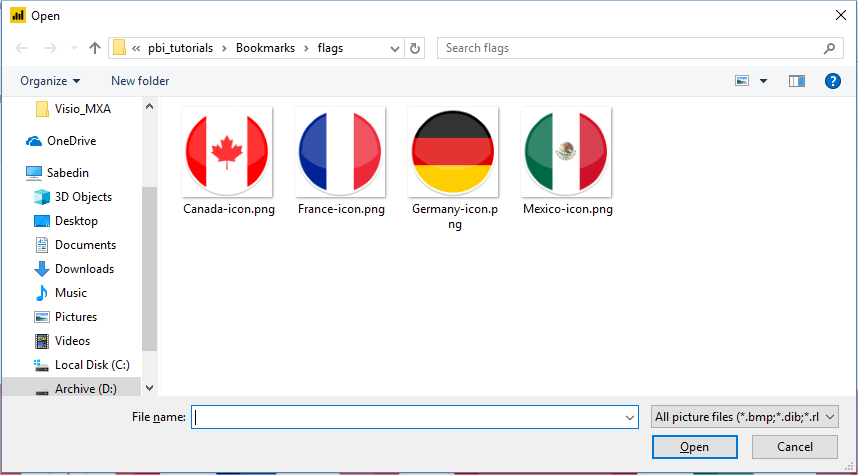
Open the file dialog box that appears and select the images you want to use. In this example, we have already downloaded the four flag images and they are ready to be used.
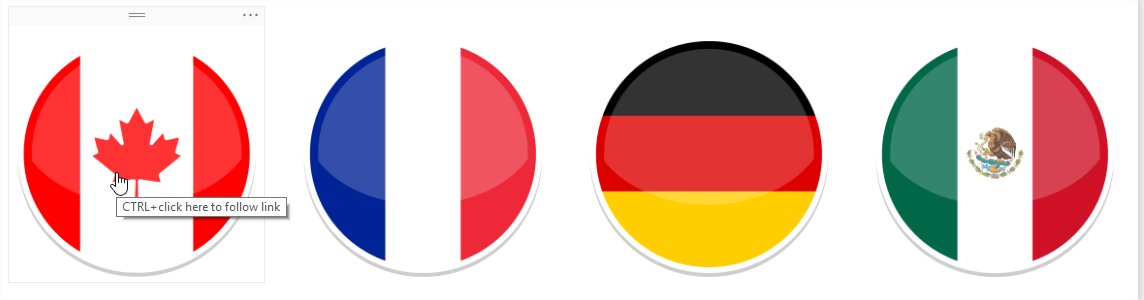
To link these images to their respective bookmarks, select the first image of the Canadian flag. Go to the Format Image Pane, set the Action button to On, select the Type: Bookmark and then select the Canada Bookmark.
Repeat this process for the other three countries.

By using Ctrl+Click, you can navigate to the specific bookmark of your choice.
The final piece of this report is the Back button, which will allow you to navigate back to the first page. To add a Back button, click Buttons and the Back icon in the dropdown. You can add it anywhere in your report.

Now, you can play around with the report by using Ctrl+Click to navigate back and forth to each bookmark and the initial page with the flag images.
Another useful Power BI feature to learn is how to load data from a folder.
Connect Microsoft Dynamics to Power BI in 5 Minutes
See how easy it is to leverage your Microsoft Dynamics AX, NAV, GP, D365BC and D365F&O ERP data in Power BI when you use Jet Analytics to consolidate all your data sources.
Watch On-Demand NowRelated Resources

The Path to Data Leadership: Embracing Embedded Analytics